Social Media Marketing Foundations
March 1, 2021
PowerPoint: Eight Easy Ways to Make Your Presentation Stand Out
August 8, 2022
Description
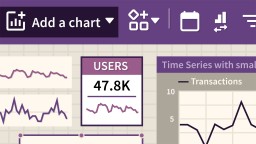
With basic knowledge of Google Data Studio, you can turn any information into sleek data visualizations full of meaningful insights. But Data Studio offers a special bonus for marketers: easy access to data sets from the entire Google Marketing Platform and social media sites such as Facebook and Twitter. Learn how to create your own engaging and interactive dashboards to track marketing campaigns with Google Data Studio, in this course with Samantha Barnes. Discover how to start a new report from scratch or from a template and connect to one or more data sources, including analytics, social, paid media, and SEO tools. Then find out how to add different types of charts and graphs to your report and add filters, style, and interactive features such as dynamic menus. Finally, learn how to maximize the visual impact of your dashboard using themes and other design shortcuts, and share your reports with clients and colleagues.
Learning objectives
- Learning objectives
- Connecting to data sources
- Adding charts and graphs
- Constructing filters
- Adding interactivity
- Creating and editing design themes
- Sharing reports


